Energy
An Electric Car Is Only as Clean as the Source of Its Electricity
Published:
Last Updated:
The fuels that a country uses to generate electricity affect the total emissions avoided by battery-powered electric vehicles (BEVs). A comprehensive “wells-to-wheels” analysis of greenhouse gas (GHG) emissions from driving a BEV compared to emissions from gasoline-powered vehicles was completed in 2015, and a new study uses that data to rank 143 of the world’s 195 currently recognized countries.
The 2015 analysis by the Union of Concerned Scientists (UCS) derived a gasoline miles-per-gallon equivalent in terms of greenhouse gases for each electricity-generating fuel source. The derived measurement is cited as MPG(ghg). According to the report, “If an electric vehicle has an MPG(ghg) value equal to the MPG of a gasoline-powered vehicle, both vehicles will produce the same amount of global warming emissions for each mile traveled.”
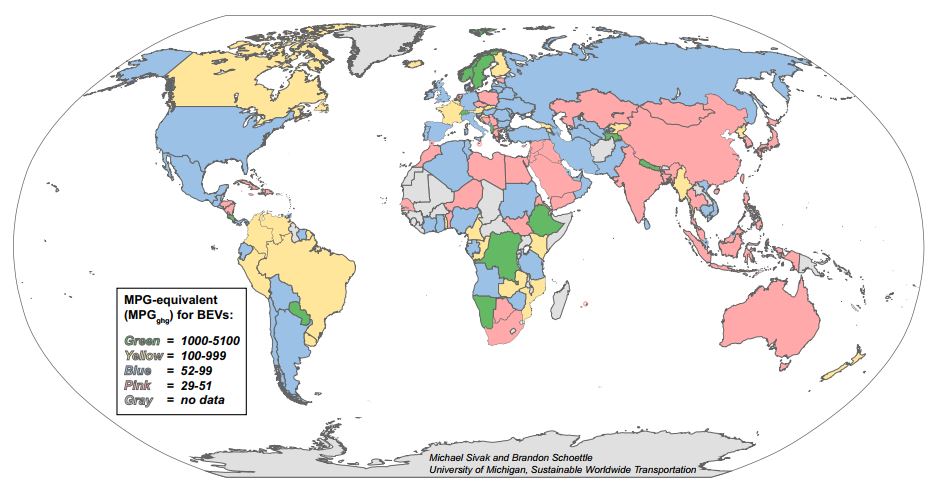
Researchers Michael Sivak and Brandon Schoettle of the University of Michigan Sustainable Worldwide Transportation unit used the UCS data along with International Energy Agency (IEA) 2015 data on the types of fuels used to generate electricity in individual countries to calculate an MPG(ghg) value for a BEV in a country. Ultimately, Sivak and Schoettle ranked the world’s 143 countries based on their MPG(ghg) values.
The results can be surprising. Albania tops the list because it generates 100% of its electricity with hydropower, which emits no GHG at all. Because hydropower is the cleanest of all fuel sources with a UCS-calculated 5,100 MPG(ghg) value, that’s what a BEV in Albania scores. Two other countries, Paraguay and Nepal, score over 5,000 MPG(ghg), which indicates that virtually all of these countries’ electricity is generated with hydropower.
The global average MPG(ghg) value is 51.5 MPG(ghg). The United States posts a value of 55.4 MPG(ghg), just above the global average, while China puts up a value of 40.0 MPG(ghg), well below the global average.
The difference between the United States and China is largely due to the far heavier use of coal to generate China’s electricity. Coal and oil have an MPG(ghg) value of 29, the worst of all eight fuels included in the UCS study. Natural gas, the other fossil fuel considered, posts an MPG(ghg) value of 58, twice that of coal or oil. Geothermal (310 MPG(ghg) and solar (350 MPG(ghg) are more than 10 times cleaner than coal or oil, while nuclear (2,300) and wind (2,500) are nearly 100 times cleaner.
A total of eight countries scored less than 30, indicating that virtually all their electricity is generated by coal or oil. Two countries, Gibraltar and Botswana, use coal or oil exclusively.
Here’s a list of the world’s 12 largest economies along with their MPG(ghg) value and corresponding fuel consumption measured in liters per 100 kilometers. The list is ordered in descending order based on the economy’s size. A map from the University of Michigan study is included at the end of this story.
A few notes on power generation:
One final note on what the University of Michigan analysis included:
For BEVs, this analysis included (1) emissions from extracting and delivering raw materials to the electric power plants, (2) emissions generated by using the specific fuel in the process of producing electricity, (3) electricity losses during electricity distribution, and (4) the fuel efficiency of the vehicle. For a gasoline-powered vehicle, the UCS analysis included emissions from (1) extracting crude oil, (2) transporting the oil, (3) refining the oil into gasoline, (4) delivering the gasoline to a retail outlet, and (5) combusting the gasoline in the vehicle.
An abstract of the Sivak-Schoettle study is available here.
Are you ready for retirement? Planning for retirement can be overwhelming, that’s why it could be a good idea to speak to a fiduciary financial advisor about your goals today.
Start by taking this retirement quiz right here from SmartAsset that will match you with up to 3 financial advisors that serve your area and beyond in 5 minutes. Smart Asset is now matching over 50,000 people a month.
Click here now to get started.
Thank you for reading! Have some feedback for us?
Contact the 24/7 Wall St. editorial team.


